
Bicycle Crash Trends in Denver: What Data Reveals About Rider Safety in 2025
Disclaimer:
The data analyzed in this blog is limited to reported bicycle crashes that resulted in a police report filed with the City and County of Denver. Unreported incidents are not captured in this dataset, which may underrepresent the true number of crashes.
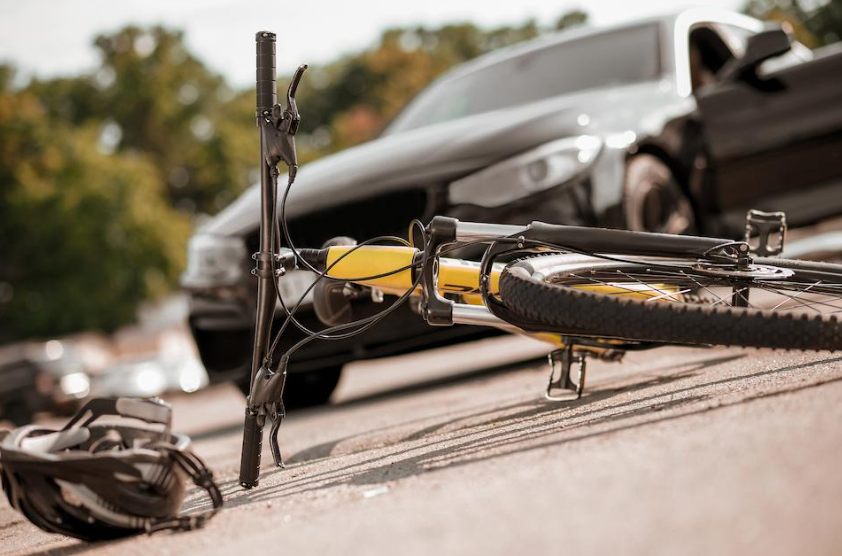
As cycling becomes more popular across Denver, so too does the need for safer streets. In 2024 alone, 178 crashes involving bicycles were reported—each one representing a serious safety concern for riders. This report analyzes the latest data from the Denver Open Data Catalog to help identify when, where, and why these accidents are happening, and what it might take to prevent them.
Where Bicycle Accidents Happen Most
Unlike motor vehicle crashes, which tend to cluster at a few key intersections, bicycle crashes in Denver are more dispersed, with no single location overwhelmingly dominating the data. However, a few sites still stand out with multiple incidents.
| Intersection | Crash Count |
|---|---|
| AURARIA PKWY / W COLFAX AVE | 2 |
| W ALAMEDA AVE / S LIPAN ST | 2 |
| E 47TH AVE / N CENTRAL PARK BLVD | 2 |
| N BROADWAY ST / E 11TH AVE | 1 |
| 3200 E 40TH AVE | 1 |
| E 12TH AVE / N COLUMBINE ST | 1 |
| 28TH ST / CHAMPA ST | 1 |
| W 14TH AVE / N PERRY ST | 1 |
| E ALAMEDA AVE / S OLIVE WAY | 1 |
| E COLFAX AVE / N GRANT ST | 1 |
This spread highlights that the risk to cyclists isn’t limited to one corridor or part of the city; it’s citywide.
When Bicycle Accidents Are Most Likely
Crash data shows clear patterns in terms of when these accidents happen. Let’s break it down by day, hour, and month.
Day of the Week
Most crashes occurred during weekdays, with Monday and Friday showing the highest numbers.
Hour of the Day
The morning and evening commute windows are the most dangerous for cyclists.
Month/Season
As expected, bicycle accidents peak in the warmer months when more riders are on the road.
Road & Environmental Conditions
Surprisingly, most crashes happen in ideal conditions—clear roads and daylight. This is most likely due to the increased number of cyclists using the roadways during nicer days and a decreased number on the roads during less optimal riding conditions.
Visibility (2024)
This suggests that weather and visibility are not the primary risk factors. Riders are getting hit in the middle of the day, on dry pavement, in good lighting. It also reinforces that intersections and turn scenarios are key areas of risk.
Contributing Human Factors
Looking at driver behavior, the most common causes of crashes were:
What This Data Really Tells Us (and How Vision Zero Informs the Solution)
The 2024 bicycle crash data presents a compelling case for road design reform, not just behavioral campaigns. Here’s why:
Cyclists Are Getting Hit in Broad Daylight, During Routine Hours
The overwhelming majority of crashes occurred:
- In daylight conditions
- On dry pavement
- Between 8 a.m. and 6 p.m.
- During peak weekday traffic
This means the typical narrative of “risky” or “reckless” cycling simply doesn’t hold. Most crashes happen when people are biking predictably—commuting, running errands, or heading home.
Vision Zero’s Position:
The City & County of Denver Vision Zero Action Plan (2017) specifically states:
“Human error is inevitable, but deaths and serious injuries are not. Street design should account for common behaviors and mistakes.”
The data supports this. We aren’t seeing crashes caused by weather or poor visibility; we’re seeing failure points in how cars and bikes are forced to share space, especially in unprotected intersections and high-volume corridors.
Turning Movements = Collision Zones
According to the dataset, turning vehicles (especially left turns) were involved in a majority of crashes. This is a well-documented threat to cyclists, particularly at signalized intersections where drivers and bikes are on a collision course.
Vision Zero Strategy Alignment:
As part of its High Injury Network mitigation work, Denver’s Vision Zero team began implementing:
- Turn calming treatments
- Leading pedestrian intervals (LPIs) for bikes
- Corner refuge islands
Cities like New York and San Francisco that have deployed protected intersections report a 30–40% drop in cyclist injuries in conflict zones. This suggests that extending protected bike lanes into the intersections (rather than having them disappear at the exact point of conflict) could significantly reduce cyclist harm.
Infrastructure, Not Awareness, Will Save Lives
Despite decades of bike safety PSAs and education, the data shows:
- Crashes are happening under good visibility
- Most drivers are at fault (based on contributing factor data)
- Nearly every crash resulted in an injury
This suggests that relying solely on driver education is insufficient. Human error is consistent and predictable. What changes outcomes is system design.
Backed by Vision Zero:
Denver’s Vision Zero Action Plan emphasizes a “safe systems” approach, which recommends:
- Separated bike lanes with vertical protection
- Road diets that reduce travel lanes and lower speeds
- Speed limit reductions on high-risk arterials
This aligns perfectly with what the 2024 crash data demands: infrastructure that makes it hard to injure someone, even if a driver makes a mistake.
Zero Fatalities ≠ Zero Urgency
While no bicycle fatalities were recorded in 2024, injury was nearly universal. That’s not success—that’s a red flag. Vision Zero stresses that serious injuries should trigger the same level of response as fatalities.
“Vision Zero is not satisfied with less than zero deaths or fewer injuries. It is about eliminating serious harm entirely.” — Denver Vision Zero Action Plan
Statewide Context:
According to the Colorado Department of Transportation (CDOT), 14 cyclists were killed statewide in 2024—a 30% decrease from 2023. However, CDOT’s report does not break down those numbers by city or county, so it remains unclear how many of those fatalities, if any, occurred in Denver proper.
Final Thoughts
From commuting hours to clear days, Denver’s most common bike crashes reflect a need for cultural and infrastructure change. This isn’t a problem of visibility or weather—it’s about behavior and design.
If you or someone you know has been injured and needs a bicycle accident lawyer in Denver, Chalat Law is here to help. Contact us today for a free consultation.